Over the past few months we have been working hard at making the portal fast and fluid. Also, we've been working on improving capabilities for users to personalize their dashboard. Today, I'd like to explore the various possibilities when customizing the dashboard and personalizing it.
The dashboard layout
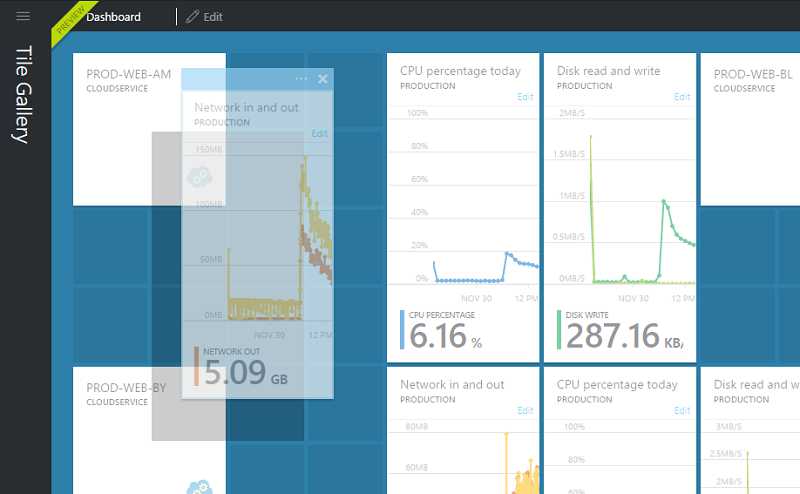
The Azure Portal dashboard has a very convenient grid layout that allows you arrange tiles according to your needs. As an example in the screenshot below, I've pinned tiles pointing to my cloud services for various regions in which I have my service deployed. And next to them, I have monitoring charts showing me live data associated to them.
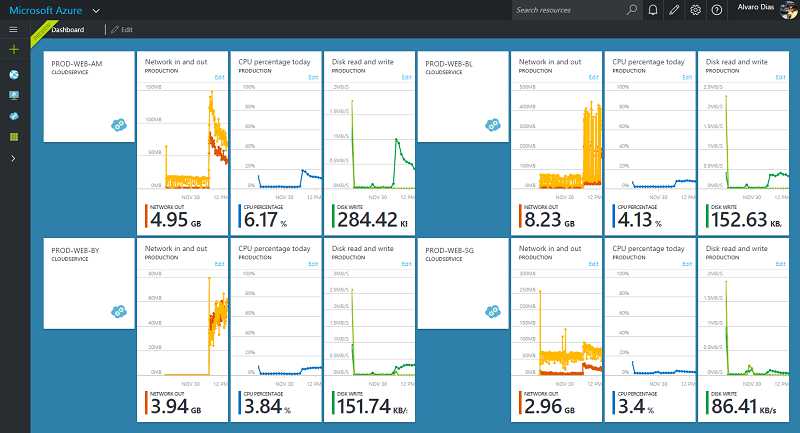
I can do this with ease because by simply clicking the Edit button, I can start rearranging tiles as I please by dragging and dropping them to their desired positions.
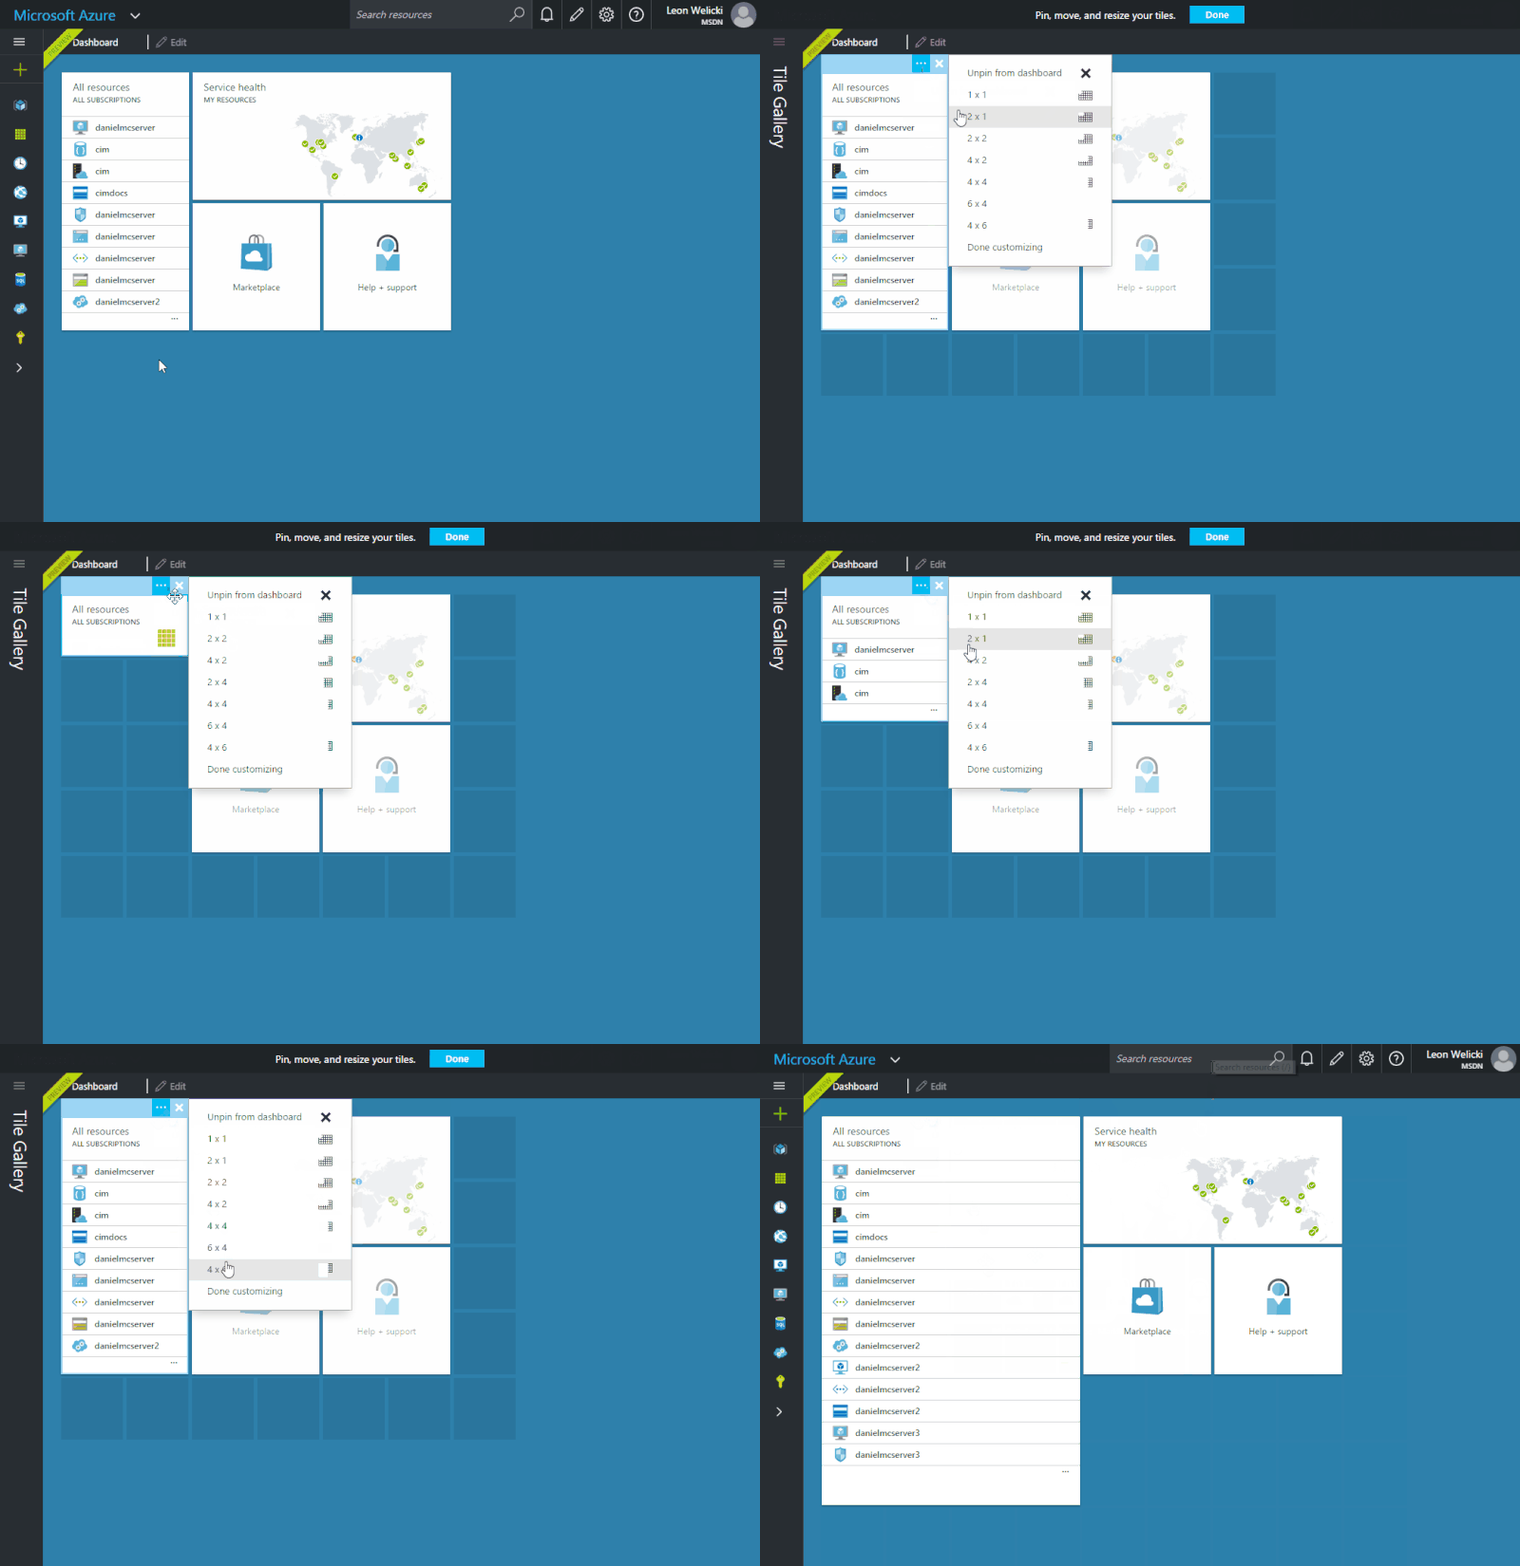
Further, you can resize tiles to custom fit your dashboard. Here's a GIF from the November update blog entry by Leon Welicki
Pinning blades and tiles
Now, the default dashboard comes pre-configured with a few useful tiles which show you the list of all your resources, health of various Azure Services that you use and links to help, support and the marketplace.
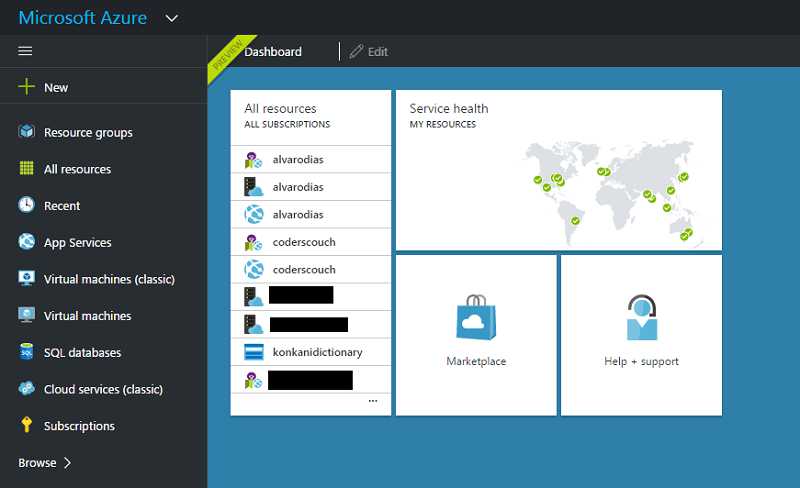
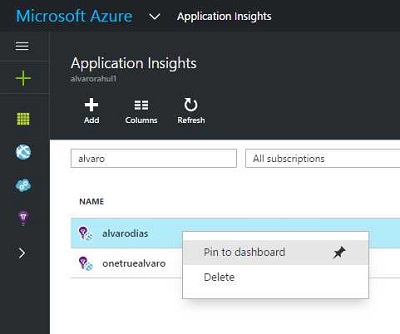
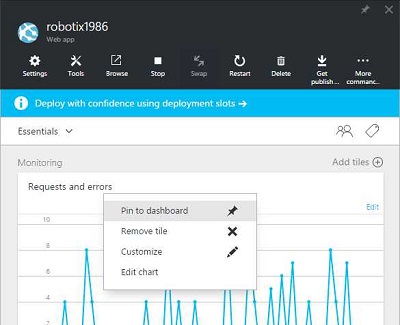
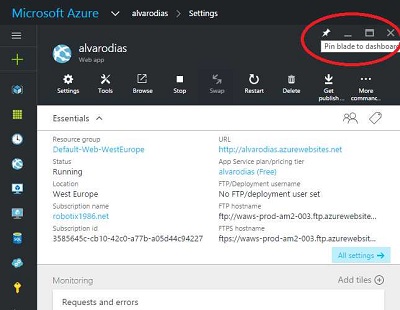
As you explore the portal, you may find various blades and resources interesting. You can choose to pin tiles associated to them to the dashboard for easy access.
Adding tiles from the gallery
The tile gallery that shows up when you edit your dashboard offers a wide selection of tiles giving you valuable insights into your Azure services.
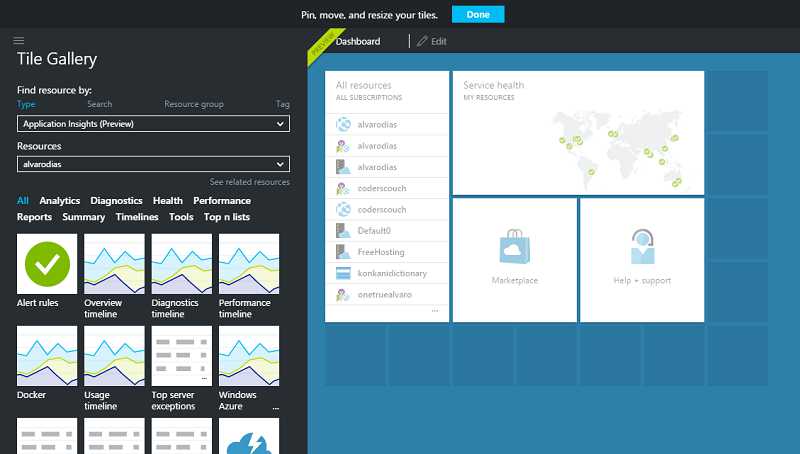
The tile gallery has a lot to offer and it deserves its own blog post. Instead, I'll just say that what should take a way is that it provides an easy way for you to find tiles relevant to you - whether by searching by keyword or filtering by resource. You can pick various tiles that allow you to monitor resources, provide diagnostics information about Azure services, reports, timelines, analytics and much more.
My current dashboard
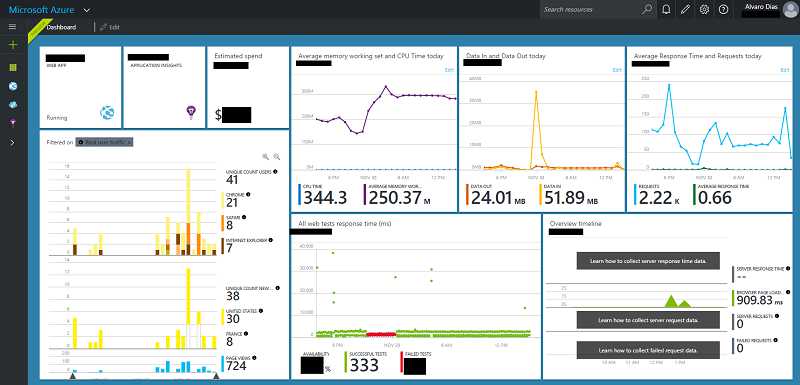
Hope this helps you become more productive on the Azure (Preview) Portal. Here's a screenshot of my current dashboard. It's helped me a lot monitor my services more effectively.
You can find more documentation and resources on the new Portal at below locations
- https://azure.microsoft.com/en-us/overview/preview-portal/
- https://azure.microsoft.com/en-us/blog/azure-preview-portal-november-2015-update/
Happy customizing!
