Happy new year! Glad to be back blogging in the new year. Previously, I've blogged on ways to customize your dashboard in the Azure Portal (used to manage your Azure resources/services). Today, I'd like to continue that discussion by exploring the tile gallery in more detail.

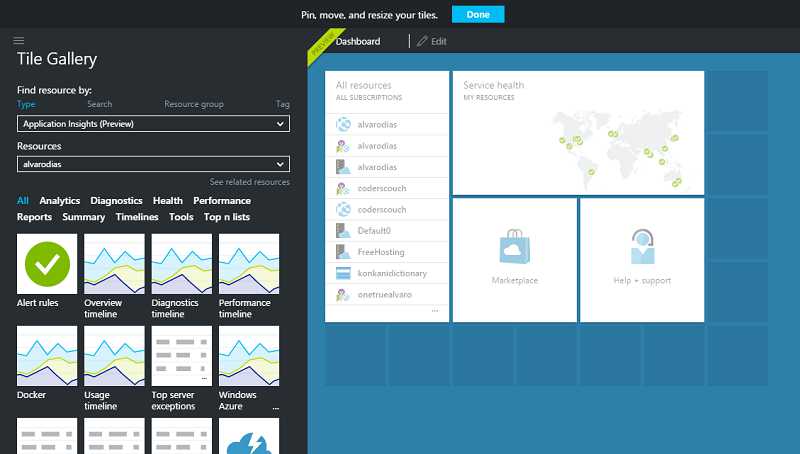
You can get to the tile gallery by right-clicking the empty space anywhere on the dashboard or any blade with tiles. The tile gallery provides a vast library of tiles with various metrics, insights, charts and graphs. You can choose from any of these for any Azure service that you own, e.g. tile with a chart displaying CPU usage over time for your Azure Web App.
Before proceeding ahead, it would be worth understanding how various Azure services you own are managed in Azure. The Azure Resource Manager overview will help you understand the concept of resources, how they can be collated together into what are known as 'Resource groups', how they can be tagged, etc.
Pivots
After you've opened it, you'll realize that there's a lot of tiles available to you. So, you're tasked with narrowing down the list of resources to the ones that are relevant to you. To help with this, a concept of pivots is provided under the "Find resource by" header.

As of publishing this post, 4 pivots are available to help you filter tiles. By default, the Resource group pivot is activated and one of your resource groups and a resource within it are pre-selected.
Type: You can select the type of Azure resource for which you want to find tiles.
Search: This one's for all of you who know the name or part of the name of resources for which you want more insights and/or visuals. Just type in your query and hit search.
Resource Group: To help narrow down the list of resources, you can first select the resource group you care about and then get a smaller list of resources to choose from.
Tag: Tags are a set of key-value pairs that can be associated with your resources. Users typically use them to group various resources together using keywords.
Selecting a tile
Once you've used a pivot to filter resources and selected a resource you want to get tiles for, you can further filter the tiles by category such as deployment, diagnostics, operations, etc. Now its just a matter of choosing one of the tiles and dragging it onto the dashboard or blade that you have open.

Related resources
There's another cool feature in the tile gallery that I personally am really excited about. The tiny link labelled "See related resources" right below the resource drop down. Clicking on this will give you a list of resources that are related to the resource you've originally chosen. These include all other resources that belong to the same resource group and also all other resources that have been linked to the original resource. You can find more information on related resources here: Related and linked resources in the tile gallery

Further reading
- Other articles I've written on the Azure portal - Articles tagged 'Azure Portal'
- Blog posts on azure.microsoft.com - https://azure.microsoft.com/en-us/blog/tag/azure-portal/
